| |
|
|
| |
| |
(1) |
Retrieve a publication about an expression study of interest from the PubMed* database |
 |
- For example, retrieve the paper mentioned above by Cui et al.
This link will open in a separate window so you can follow the steps below.
* As an alternative to starting in the PubMed database, you can begin a search directly in the GEO DataSets (step 2) or GEO Profiles database (step 3), then press the "FIND PATHWAYS" button (step 4) on the GEO Profiles search results page.
| |
(2) |
Retrieve a curated set of the study's data from the GEO DataSets database |
|
- While viewing the PubMed record, look for the "Related information" box in the right margin of the display.
- Click on the "GEO DataSets" link to retrieve records that briefly describe the study and link to the expression data (expression profiles) from the samples used in the study. Two GEO records will appear:
- GSE5786, the GEO SERIES record that contains the submitter-supplied information
- GDS2391, the GEO Data Set that contains the curated version of the data, which allows user comparison of experimental values for different experimental conditions and includes additional links to related data in the Entrez system. (The GEO overview page provides more information about the various types of GEO records.)
- Click on GDS2391 to retrieve the curated record.
| |
(3) |
Retrieve individual gene expression profiles from the GEO Profiles database, then limit the set to the genes that had statistically significant expression changes database |
|
- If you are still viewing the GEO DataSets search results page, follow the "GEO Profiles" link that appears to the right of GDS2391. (Alternatively, if you opened the GDS2391 record, click on the "Expression Profiles" button near the top of the display.) That will retrieve expression data for all the genes in the study, regardless of whether their expression was up-regulated, down-regulated, or unchanged by the study's experimental conditions.
- Reduce the set of GEO Profiles records to show only the genes that were up-regulated or down-regulated* by the study's experimental conditions. To do this, add the following string to the query displayed in the search box near the top of the GEO Profiles page:
... AND ("rank subset effect"[FTYP] OR "value subset effect"[FTYP])
In this example, the query in the search box would become:
GDS2391[ACCN] AND ("rank subset effect"[FTYP] OR "value subset effect"[FTYP])
Now the GEO Profiles search results page will list only the genes that had statistically significant expression changes, reducing the retrieval from the initial ~45,000 genes to the currently displayed ~450 genes.
* Note that other methods for determining significance are available in the "Data Analysis Tools" found in a GEO DataSet record, such as "Compare 2 sets of samples." For example, open another sample expression study, GDS402, select "Compare 2 sets of samples" from the left margin of the page, then choose the desired test and data samples. The results of the comparison will appear on a GEO Profiles search results page.
| |
(4) |
Retrieve a ranked list of pathways containing one or more genes that showed statistically significant expression changes |
|
- While viewing the GEO Profiles search results page that lists only the up-regulated or down-regulated genes, press the
 button in the right-hand margin of the page, under the "Profile Pathways" header. button in the right-hand margin of the page, under the "Profile Pathways" header.
- That step automatically retrieves a list of the corresponding Entrez Gene records and passes those GeneIDs to the FLink tool, which then retrieves all pathways from the BioSystems database that are linked to to one or more of those GeneIDs and ranks the biosystems in priority order by either:
- Click on any value in the frequency column to see the specific subset of genes from your input list that is involved in the biosystem.
- The job summary panel on the FLink output page lists the specific steps that FLink followed to retrieve the biosystems and allows you to save the original list of GEO Profiles records, the list of corresponding GeneIDs, and/or the list of BioSystems as a comma-separated value (CSV) file.
|
|
| |
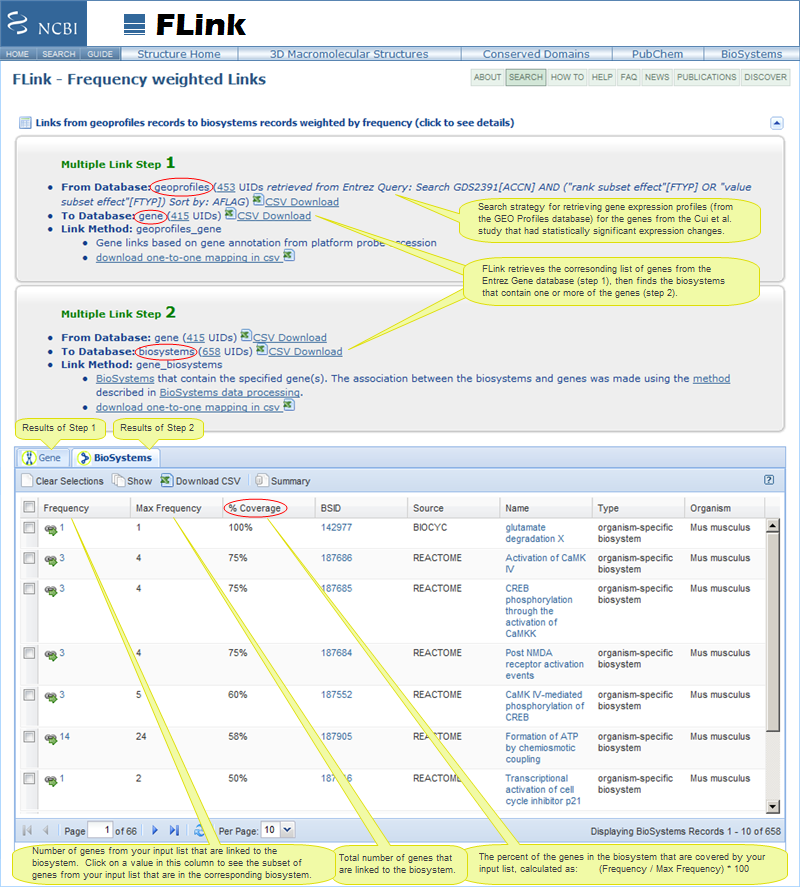
(5) |
Illustration of FLink Output: Pathways containing one or more genes that showed statistically significant expression changes, ranked by percent coverage † |
|
|
|
|
| |
† Note about the "Percent (%) Coverage" column: Currently, if you search the GEO Profiles database and press the "Find Pathways" button on the search results page, the resulting list of pathways will be ranked by Frequency by default. If you prefer to rank them by "% Coverage," add the following parameter to the URL that appears after you press the "Find Pathways" button:
&score=1
For example:
- Search the GEO Profiles database with a query such as the one shown in step 3 of the example above. Or, as a shortcut for the purpose of this example, just click on the following URL:
GDS2391[ACCN] AND ("rank subset effect"[FTYP] OR "value subset effect"[FTYP])
- On the GEO Profiles search results page, press the "Find Pathways" button and a URL that contains a "query key" will appear. The query key value you see on your computer might vary from the example below:
https://www.ncbi.nlm.nih.gov/Structure/flink/flink.cgi?cmd=multilinkto&db=geoprofiles,gene,biosystems&link=geoprofiles_gene,gene_biosystems&query_key=1
- Append the parameter "&score=1" to the URL, so it becomes:
https://www.ncbi.nlm.nih.gov/Structure/flink/flink.cgi?cmd=multilinkto&db=geoprofiles,gene,biosystems&link=geoprofiles_gene,gene_biosystems&query_key=1&score=1
- The resulting FLink output will then show the Max Frequency and % Coverage columns, in addition to the Frequency column.
|
|
|
| |
|